S&P 500 at Record Highs: Strong Trend, Louder Warning
By SCAD3D Insights
- S&P 500
- SPX
- Stock Market
- Market Cycles
- Gold
- RSI
- Stochastic RSI
- Benner Cycle
- Investing

Stocks are near record highs, gold is strong, and long term momentum is stretched. The trend is still bullish, but this is not the place to confuse strength with safety.
The S&P 500 is doing what it does best.
It keeps climbing, keeps rewarding risk, and keeps making everyone feel like they suddenly understand markets.
Stocks are near record highs. Gold is strong. Momentum is hot. The mood is confident. Maybe too confident.
That does not mean the market has to crash tomorrow.
Markets do not usually send polite calendar invitations before ruining the party.
But this is not a quiet setup either.
This is the kind of market where people say, “I am a long term investor,” when what they really mean is, “I bought recently, it went up, and now I have developed a personality around it.”
So the question is not whether the market is strong.
It clearly is.
The better question is whether this is early stage strength, or late stage strength.
Those are very different things.
Applying the 3D Framework
-
Direction — Still bullish. The long term trend is up, price is near record territory, and momentum has not broken yet. That matters. A strong market can stay strong much longer than cautious investors expect. Being bearish just because something looks expensive is a good way to sound smart while missing the move. The trend deserves respect.
-
Depth — This is where the modern chart becomes useful. On the long term 2 month S&P 500 chart, price is pressing near the upper part of a large rising structure. The RSI is sitting above 80, and the Stochastic RSI is near the top of its range. Similar pressure zones appeared around 2014, 2018, 2022 and now 2026. That does not prove a top is here. It simply tells us the market is in a zone where past cycles became more fragile.
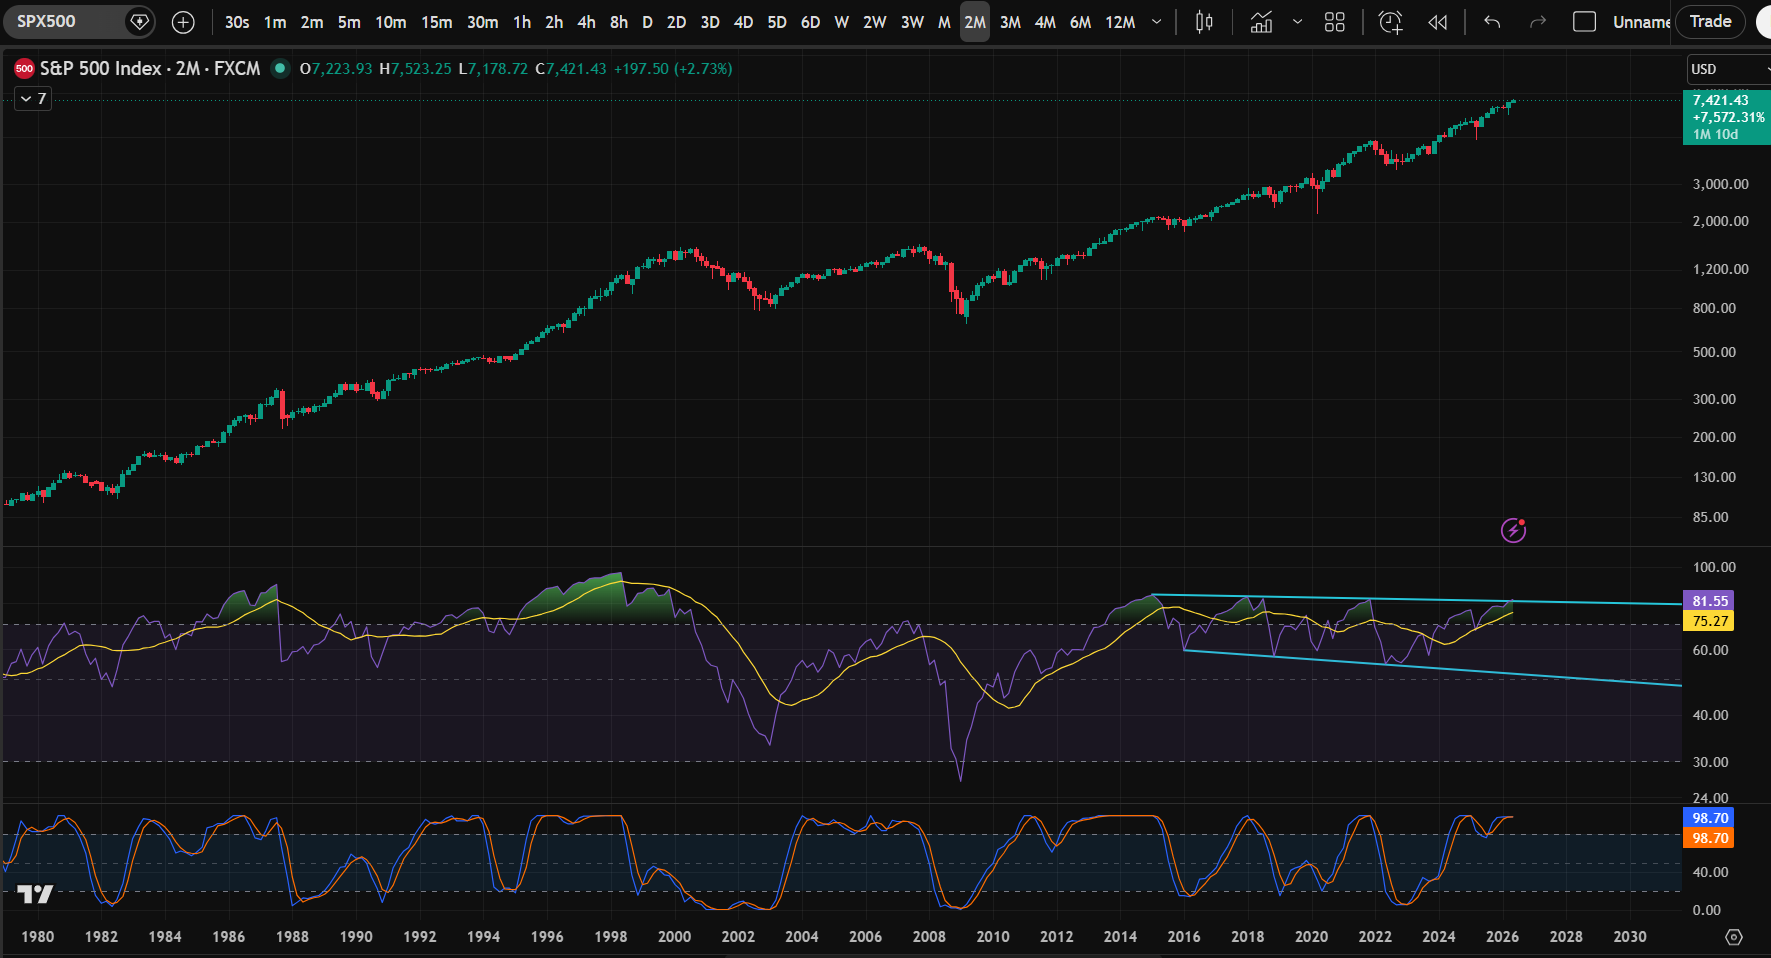
- Downside — The main risk is not one red candle. The main risk is complacency. Investors often see all time highs and assume the market is healthy. Sometimes it is. Other times, the market is stretched, crowded and waiting for a reason to punish lazy positioning. The trigger usually gets named later. The setup appears first.
The Pattern Problem
The interesting part is the rhythm.
2014. 2018. 2022. 2026.
Every four years, the S&P 500 seems to return to a similar long term pressure zone. That sounds almost too clean, which is exactly why it should not be treated like magic.
Markets are not clocks.
They do not ring a bell and say, “Dear investor, this is the top. Please act accordingly.”
But markets do form habits.
They get strong. They get extended. People start believing every dip must be bought. Then risk slowly becomes invisible. That is usually when risk becomes more important, not less.
The current structure can still be read as bullish. A long term bull flag can break higher. If it does, the move could be powerful. That is why blindly shorting a strong market is dangerous.
But a bull flag near the upper edge of a long term channel is not the same thing as a cheap market at the beginning of a cycle.
One is opportunity.
The other is opportunity with a warning label.
The Momentum Clue
The key signal is not only price.
It is momentum.
On the 2 month view, Stochastic RSI is sitting near the upper range. That tells us upside momentum is still strong, but it also tells us the fuel tank is no longer full.
The real warning would come if momentum crosses down from the upper zone while price is still near long term resistance. That kind of setup has mattered before around major turning points.
No, that does not mean “sell everything today.”
It means this is not the place to become careless.
Overbought markets can stay overbought. They can keep rising and make cautious people look ridiculous for months. But when long term momentum finally rolls over, the market usually does not wait for retail investors to finish thinking.
The Old Cycle Chart
Then there is the old cycle chart.
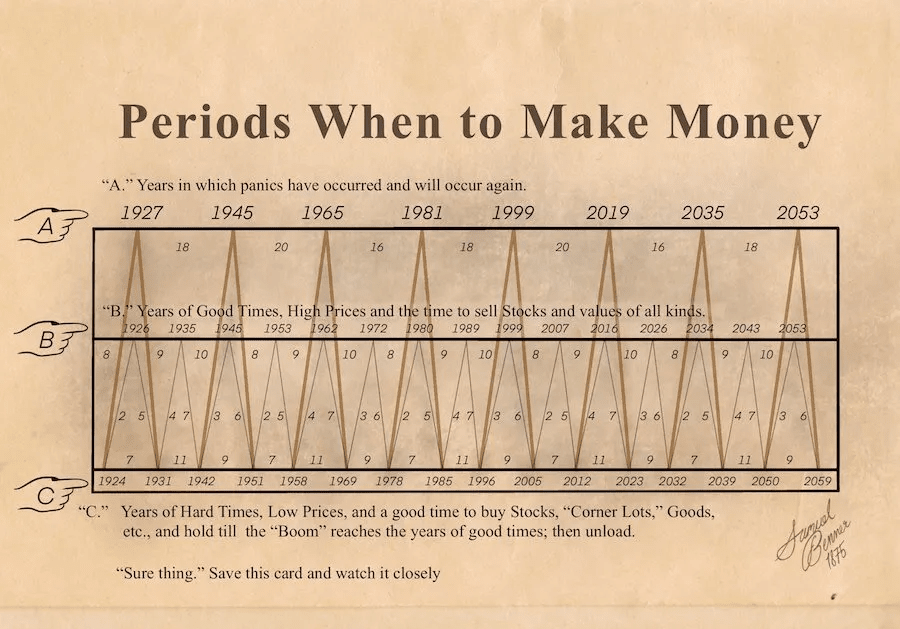
The chart is often linked to the Benner Cycle, or the old “Periods When to Make Money” idea. It divides market history into three broad zones: panic years, good times with high prices, and hard times when assets are cheaper.
The interesting part is that 2026 appears in the “B” row.
That row is described as years of good times, high prices and a time to sell stocks and values of all kinds.
Is that proof?
No.
Markets do not obey antique paper.
But it is interesting.
Especially because 2023 appears near the lower “C” area, which is described as a better buying period. Looking back, 2023 was indeed a strong time to buy many risk assets. Now, in 2026, the market is near record highs, long term momentum is stretched, gold is strong, and investor confidence is everywhere.
I would never use this old chart alone.
But when an old cycle chart, a stretched long term RSI, a hot Stochastic RSI and record high prices all point to the same message, it is worth listening.
Not panicking.
Listening.
What Investors Should Watch
Watch momentum first. If the Stochastic RSI rolls over from the upper zone on the 2 month chart, that would be a serious warning.
Watch breadth. If the index keeps rising but fewer stocks participate, the market is getting weaker under the surface.
Watch gold. If gold stays strong while stocks also rise, the market may be showing confidence and anxiety at the same time.
Watch your own behaviour. If you are buying only because everyone else sounds bullish, that is not a thesis. That is crowd pressure with a brokerage account.
Takeaway
The S&P 500 trend is still strong.
But strong does not always mean safe.
This market could still break higher. If momentum holds and price pushes cleanly above the long term structure, the bulls may get another powerful leg.
But if price stalls near the upper channel while momentum rolls over, the setup becomes much more dangerous.
The better question is not:
“Will the market crash?”
The better question is:
“Am I being paid enough to take risk at this stage of the cycle?”
If the answer is yes, have a plan.
If the answer is no, patience is allowed.
Waiting is not weakness. Sometimes it is just refusing to buy excitement at full price.
Risk Notes
Technical analysis is not a guarantee. Long term cycle patterns can fail, overbought markets can keep rising, and record highs can lead to more record highs.
Old cycle charts can be interesting, but they should not be treated as prophecy. They are tools for thinking, not tools for predicting the future with certainty.
Market timing is difficult. A cautious view can be early, and being early can feel exactly like being wrong.
Nothing here is financial advice or a recommendation to buy, sell or trade any security, index product, ETF, commodity, crypto asset or derivative. I am not your advisor and do not know your situation, jurisdiction or risk tolerance. Do your own due diligence and speak with a licensed advisor before making portfolio decisions.
The trend may be real. The warning may also be real.
Try not to confuse strength with invincibility.
Found this useful?
Source note: Based on long term S&P 500 chart analysis, RSI, Stochastic RSI, historical market cycle patterns and the old “Periods When to Make Money” cycle chart.
Disclosure: SCAD3D Insights holds no position in the mentioned assets at the time of publication.
More Insights

Broadcom Drops 14%: Is the AI Market Rotation Real?
Broadcom dropped 14% on 4 June after beating earnings. Nvidia is up 19% YTD while AMD is up 143%. Is this the start of AI market rotation, or just a buy-the-dip moment?
- Broadcom
- AVGO
- AI Market Rotation
- AI Stocks
- Nvidia
- AMD
- AI Chip Selloff
- Priced for Perfection
- Sector Rotation
- Stock Market 2026
- AI Bubble
- IPO Supply

NVIDIA vs Dell: The AI Infrastructure Trade Explained
NVIDIA captures the highest-margin layer of the AI boom. Dell shows how much of that demand is becoming real servers, racks and data-center infrastructure.
- NVIDIA
- NVDA
- Dell
- DELL
- AI Infrastructure
- AI Servers
- Data Centers
- Semiconductors
- AI Chips
- AI Compute

Copper Market 2026: Supply Squeeze, EV Demand and How to Invest
Copper prices are rising because the world needs more electricity, EVs, grid upgrades and data centres, while supply remains tight. Here is the copper thesis in plain English.
- Copper
- Copper Price
- Copper Investing
- Copper ETF
- Copper Miners ETF
- CPER
- COPX
- Boliden
- Aurubis
- EV Demand
- Energy Transition
- China Copper Demand
- Copper Physical Premiums